In a contact center, call monitoring is a critical practice for assessing output and for identifying agent performance opportunities. There are two primary approaches/objectives when observing an agent’s calls:
- To generate a score for an agent-level metric presumed to reflect call quality or process compliance, or
- To develop a remedial or coaching plan to improve agent performance based on root cause analysis.
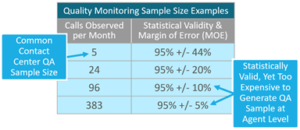
Unfortunately, software firms have long pushed the scored call approach in an effort to make their recording platforms relevant and cost justified; however, small sample size has always been an issue (see below). Some vendors are finally acknowledging that scorecard driven QA programs have under-sampled call volume for years, but this admission only comes to boost their sales rhetoric for automated call scoring through speech analytics. While the automated approach may measure 100% of the calls for compliance, it is impossible to gauge the nuances of complex call handling with technology alone. A true assessment of agent call handling effectiveness and skill gap identification requires intelligent listening and context, which will always involve the human element (i.e., supervisors or QAs). Only when reporting on vendor (outsourced) operations does McIntosh recommend a scored approach.
STATISTICAL VALIDITY CHALLENGES WITH CALL MONITORING SAMPLE SIZE
Obtaining a statistically valid sample to generate agent scorecard metrics requires more monitoring resources than a contact center can afford, as explained by the chart at right. The small monthly sample sizes generated by most contact centers along with the traditional “checklist” QA approach cannot yield the data insights required to improve agents’ skills.
CALL SEGMENT MONITORING BENEFITS
McIntosh advocates for root cause analysis call observations and suggests that our clients utilize segment or partial call monitoring to deliver multiple benefits:
- Less time is required to monitor segments vs. full calls, thereby improving observer productivity
- Monitoring is focused on a specific performance gap and is thus more likely to deliver actionable insights
- Yields a larger sample of observations, which validates that performance defects are not anomalous
- Represents a targeted vs. random sample, increasing probability that relevant data can be generated
- Eliminates the scoring element, thereby relieving tension as the agent begins to understand that the monitoring and feedback objectives are to help him/her improve performance and be successful
THE METHODOLOGY
To effectively monitor call segments, we must first identify the performance gap (e.g., high AHT, low sales conversions, etc.) and then listen to the call segment(s) most likely to reveal the underlying skill defect. Based on findings, the supervisor can then develop a training or coaching plan to address the issue(s).
| Metric Examples | Call Monitoring Activity Examples |
| High AHT | Look at drill down data for ATT (Average Talk Time), ACW (After Call Work) and Hold times to determine if any or all of the AHT components are excessively high. Based on the area(s) where the agent is not meeting expectations, conduct segment monitoring on at least 10-15 calls.
|
| Low Sales (Conversion Rate, Sales/Hour, or Revenue/Call) | Listen to the call opening to verify that the call is a sales opportunity, and then monitor the call to confirm the root cause of low sales effectiveness. You may target both shorter and longer calls, each for very specific reasons:
|
| Low First Call Resolution (FCR) | Typically individuals with lower than average FCR tend to have longer calls as they search for information; however, short calls can also be a concern if an agent relies exclusively on memory and gives out incorrect information. The approach here is to listen to the call opening, determine if this is a call opportunity for resolution, and then listen for behaviors that negatively impact resolution results, including:
While there are other examples of root cause driving low FCR, these examples indicate the primary challenges experienced by agents. |
McIntosh has outlined more performance management best practices in our recent Insights Article, “Work at Home Teams: Techniques for Enhancing Performance Results,” which can be found on our website.
Additionally, in conjunction with segment monitoring, McIntosh recommends the use of customized fishbone diagrams to identify and quantify the number of times specific behaviors are utilized by an agent on a call. The fishbone replaces the traditional QA “checklist” form and is geared specifically for root cause analysis (no scoring). For a free copy of a fishbone diagram that you can customize to your own operation, please contact Beverly McIntosh at bmcintosh@mcintoshassociates.com


